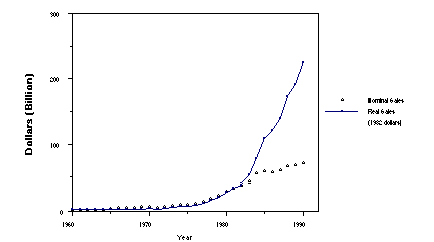
 Graph 1. Real and Nominal Purchases of
Computers.
Graph 1. Real and Nominal Purchases of
Computers.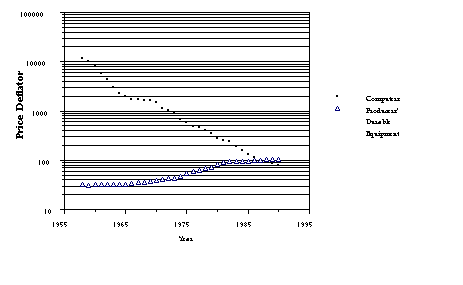 Graph 2. The cost of computing has
declined
substantially relative to other capital purchases.
Graph 2. The cost of computing has
declined
substantially relative to other capital purchases.
Acknowledgments: Tim Bresnahan, Vijay Gurbaxani, Lorin Hitt, Tom
Malone, Michael Piore and participants at the MIT Information
Technology Seminar, the MIT Industrial Performance Seminar, the
National Bureau of Economic Research (NBER) Workshop on
Productivity
and the Workshop on Information Systems and Economics (WISE)
contributed
valuable comments on this research. David Cartwright and Allan
Young at the Bureau of Economic Analysis were helpful in providing
essential data and advice. Funding by the Center for Coordination
Science, the International Financial Services Research Center
and the Industrial Performance Center at MIT is gratefully
acknowledged.
Graph 2. The cost of computing has declined substantially relative to other capital purchases.
2.2 Business Performance Metrics
2.3 Consumer Surplus from Derived Demand
2.4 Comparing the Three Approaches
2.5 Definitions of Consumer Surplus
3.2.2 Simultaneity: A natural experiment and instrumental variables estimates
Figure 6. The "natural experiment" of shifting supply curves.
Table 2: Elasticity estimates by sector and for the economy for OCAM
Table 4: Consumer Surplus estimates for COMPUTERS.
Table 5: Consumer Surplus estimates for OCAM by sector and for whole U.S. economy.
Over the past decade, American businesses have invested heavily
in information technology (IT) hardware. Unfortunately, it has
been difficult to assess the benefits that have resulted. One
reason is that managers often buy IT to enhance customer value
in ways that are largely ignored in conventional output statistics.
Furthermore, because of competition, firms may be unable to capture
the full benefits of the value they create. This undermines researchers'
attempts to determine IT value by estimating its contribution
to industry productivity or to company profits and revenues.
An alternative approach is to estimate the consumer surplus from
IT investments by integrating the area under the demand curve
for IT. This methodology does not directly address the question
of whether managers and consumers are purchasing the optimal
quantity
of IT, but rather assumes their revealed willingness-to-pay for
IT is an accurate indicator of their preferences. Using data
from the U.S. Bureau of Economic Analysis, we estimate four
measures
of consumer welfare, including Marshallian surplus, exact surplus
based on compensated (Hicksian) demand curves, a non-parametric
estimate, and a value based on the theory of index numbers.
Interestingly,
all four estimates indicate that in our base year of 1987, IT
spending generated approximately $50 billion to $70 billion in
net value in the U.S. Our estimates imply that the value created
for consumers from spending on IT is about three times as large
as the amount paid to producers of IT equipment, providing a new
perspective on the IT value debate.
In 1990, American businesses spent over $43 billion on "office,
computing, and accounting machinery" (OCAM[1]). Nominal spending
has increased substantially over the past several decades and
in real terms the increase has been even more dramatic because
of annual declines exceeding 20% in the real price of computing
power (graph 1 and graph 2).
While the economic significance of this spending is apparant in
the rise of firms such as Microsoft and Intel, and before them,
IBM and DEC, the benefits to consumers in the broader economy
have been more difficult to quantify. For instance, Baily and
Gordon (1988) ask "Where is the black hole into which all
those computers are disappearing?" and government statistics
suggest that the service sector, which is the largest consumer
of computers, has had only insignificant productivity growth in
over a decade.
Graph 1. Real and Nominal Purchases of
Computers.
Graph 2. The cost of computing has
declined
substantially relative to other capital purchases.
Yet, there must be more to the impact of computers than meets
the statistician's eye. A visit to Wall Street, or any large bank
for that matter, will reveal products, services and transaction
processing capabilities that would have been simply impossible
without enormous computer power. For instance, the New York bank
deposit turnover ratio (annual value of transactions divided by
deposits on hand) has increased to 3804 in 1990 from just 156
in 1960.
A number of explanations have been put forth for this paradox,
but among the most compelling is the inherent difficulty in applying
traditional productivity metrics to the types of benefits enabled
by information technology (IT) (Brynjolfsson, 1993). Managers
invest in IT not only to reduce costs, but also to improve quality,
increase product variety, speed up responsiveness and enhance
customer service. However, these intangible benefits are largely
ignored in conventional output and productivity statistics because
they are difficult to measure, aggregate, and value. In practice,
productivity measurement focuses on increases in the physical
quantity of production and reductions in costs, especially head
count.
Furthermore, because of competition, firms are typically unable
to capture the full value of the intangible benefits they create
but nonetheless find that they must provide these benefits as
the "cost of staying in the game". The ultimate beneficiaries
of lower prices, increased quality or better customer service
are consumers. This undermines researchers' attempts to estimate
value looking at company profits or revenues. Thus, there may
be a fundamental clash between the sources of value created by
computers and the metrics that researchers have been using.
In this paper, we depart from the approach of estimating production
functions and firm performance. Instead, we consider the revealed
preference of IT consumers who "put their money where their
mouths are" every time they make a purchase. Specifically,
we focus on the consumers' valuation and the economic concept
of consumer surplus. Because data is available that enables
fairly accurate estimates of the demand for IT, this approach
provides a promising alternative to productivity, profit, or
output-based
estimates of the value of IT. Furthermore, since this approach
requires different assumptions than those required for productivity
calculations, it may enable us to better "triangulate"
on the true value of computers and IT.
Our estimates indicate that in the 1980s, IT generated over $400
billion dollars in net value in the U.S. after subtracting the
costs of expenditures over that period. In our base year of
1987, we estimate that computers created between $80 and $90 billion
in value, compared to costs of about $40 billion. Furthermore,
at current rates of price declines and spending growth, consumer
surplus from computers is projected to reach over $200 billion
annually by 1997.
The next section discusses the various approaches to estimating
IT value with particular attention to the theory of consumer surplus
which will be applied. Section three describes the features and
limitations of data and the econometric methods used. The results
are presented in section 4, including some sensitivity estimates.
In section 5, we conclude with a summary and discussion of future
directions for the work.
2. The Theory Underlying Three Approaches to IT
Value Estimation
Economic theory suggests at least three general approaches for
econometrically estimating the value of an input such as IT:
1) output and productivity estimation, 2) correlations with
performance
metrics such as profits, revenues, or stock values, and 3) consumer
surplus from derived demand.
The first approach is based on the idea that inputs can be related
to outputs by a production function.
![]()
Thus, the only way for a firm to increase output is to increase
at least one of the inputs, or to change its technology or management
so that its production function becomes more efficient. This
is the approach taken by Loveman (1988) , Barua, Mukhudpadhyay
and Kriebel (1991) , Morrison and Berndt (1990) and Brynjolfsson
and Hitt (1993) , among others.[2] Typically a
functional form for
a production function is assumed and the parameters are
econometrically
estimated under the assumption that firms are minimizing costs
or maximizing profits. For instance, in estimating a Cobb-Douglas
production function such as (2), the parameter ![]() 1
can be interpreted directly as the output elasticity of
computers: the amount by which output will increase for a given
increase in computer input.
1
can be interpreted directly as the output elasticity of
computers: the amount by which output will increase for a given
increase in computer input.
Output = ![]() (2)
(2)
A key assumption of this approach is that final output is reliably
measured.
2.2 Business Performance Metrics
The second common approach is to measure the correlation between
computer spending and some performance metric, as suggested by
equation 3.
![]()
Typical performance metrics used include (growth in) business
profits, (growth in) sales, (growth in) market share, stock price
appreciation, and various industry-specific measures. While there
are numerous ways to operationalize such a relationship, they
all seek to isolate the contribution of computers while controlling
for other factors. (For instance, (Cron & Sobol, 1983; Dos
Santos, Peffers & Mauer, 1993; Harris & Katz, 1989; Weill,
1992) ). If managers are
rational,
economic theory predicts that in equilibrium, high computer investors
would not, on average, perform any better than low computer
investors
by these metrics. If significant correlations are found, they
should be interpreted as indicating an unexpectedly high
or low contribution of information technology, as compared to
the performance that was anticipated when the investments were
made.
In addition, a key assumption of this approach is that businesses
retain the value created by their investments in IT, or at least
capture a significant portion of it.
2.3 Consumer Surplus from Derived
Demand
A third approach is based on the theory of consumer surplus, which
has been little-applied to the question of IT value. Consumer
surplus uses the theory of demand to compute the total consumer
benefit based on revealed spending patterns.
The demand curve for any good plots the price that buyers would
be willing to pay for each incremental quantity of that good.
Because all the infra-marginal consumers actually pay
less than what they would be willing to pay, they get some surplus
from the transaction. By adding up all these individual surpluses,
or equivalently, by integrating the area under the demand curve
between the old price (p0) and the new price
(p1), one can deduce the total value of
consumer
surplus from a price change.
![]() (4)
(4)
In a competitive market, it can be proven that producers who purchase
an intermediate good will act as proxies for the ultimate consumers:
they will purchase exactly the quantity that maximizes consumer
welfare at any given price. Therefore, the area under the derived
demand curve for the intermediate good will be the correct estimate
of consumer surplus from the intermediate good (Schmalensee, 1976) .
Bresnahan (1986) has shown that the area under the derived demand
curve is also the appropriate estimator for consumer surplus in
regulated industries, and that when competition is imperfect,
it will generally underestimate total surplus created by a price
change.
A key assumption of this approach is that managers are, on average,
choosing the right amounts of IT, given its price.
2.4 Comparing the Three Approaches
Equations (1), (3), and (4) above can each be used to assess the
value created by spending on a given input to production. One
or the other approach will be more appropriate depending on the
precise question being asked and whether the required assumptions
are realistic in the particular case being considered.
As discussed above, for IT there is reason to believe that the
dimensions of output most affected by increased investments are
poorly measured in final output statistics. As a result, they
may be underestimated or even ignored in productivity calculations,
especially at the aggregate level. This limits the applicability
of approaches relying on the production functions such as equation
(1). Furthermore, in fully competitive markets, all of the benefits
of a price decline for an intermediate good may be passed on to
consumers, because of "competitive necessity" (Clemons,
1991) . This makes the approach embodied in business performance
metrics such as equation (3) problematic. Finally, with a relatively
new and uncertain technology such as computers, managers may have
difficulty making correct investment decisions. This will tend
to undermine the accuracy of estimates based on consumer surplus
as in equation (4).
There are a number of reasons that it is worthwhile applying consumer
surplus to derive estimates of IT value. First, applying this
approach can tell us how much value the purchasers of IT think
they are getting, and by identifying the extent and the sectors
in which this differs from productivity or performance metrics,
we should be better able to find the source of the discrepancy.
For instance, by putting upper and lower bounds on the size of
the "mistakes" we think are plausible, we can put upper
and lower bounds on the total surplus created, and by comparing
services (where output measurement is often poor) to manufacturing
(where measurement is typically better) we can calibrate the size
of potential measurement shortfalls.
Second, the errors in estimating IT value via productivity and
business performance metrics are likely to lead to systematic
underestimates of IT value, because of underestimates of output
and the shift of benefits to consumers respectively. In contrast,
consumer surplus estimates are based on the willingness-to-pay
of the purchasers of IT. While managers will certainly make mistakes
in the amount of IT they purchase, there is less reason to believe
that these mistakes will systematically lead to over- or
underinvestment. Because the consumer surplus estimates will
be approximately accurate if managers are as likely to make either
mistake, there should be less bias in these estimates.[3]
Third, each of the three approaches are subject to different
types of weaknesses. This makes it valuable to use a variety
of methods to help triangulate on the true value of IT. In the
past, efforts have focused on the productivity or the performance
metric approach, to the neglect of consumer surplus.
Finally, judging the contribution of a technology by the amount
that its consumers are willing to pay accords well with the
long-standing
economic tradition of taking the consumers' preferences as sovereign.
Because many of the benefits of IT may be difficult for the statistician
or accountant to measure, it seems especially appropriate to take
heed of the actions of the parties who spend the most time evaluating
the costs and benefits of each decision.
2.5 Definitions of Consumer Surplus
Although the basic concept of consumer surplus is simple, there
are a number of ways of operationalizing it. Below, four basic
approaches and the relevant formulae are described, including
1) Marshallian surplus, 2) exact surplus based on compensated
(Hicksian) demand curves, 3) a non-parametric estimate, and 4)
a value based on the theory of index numbers. Under the assumptions
of perfect competition, each of these approaches is appropriate
for use with either demand curves for final goods, or derived
demand for intermediate goods. Later, we will discuss the significance
of relaxing the assumption of perfect competition for the
interpretations
of surplus based on derived demand.
2.5.1 Marshallian Consumer Surplus
The most common conception of consumer surplus is based on
ordinary
(i.e. Marshallian) demand. As shown in figure 1, a price decline
from P0 to P1 will
be
accompanied by a increase in quantity purchased from Q0
to Q1. The consumer surplus consists of two
parts, the direct reduction in price on units that would have
been purchased anyway (denoted by A) and the increase in welfare
from additional units whose cost is now less than the consumers'
willingness to pay (denoted by B).
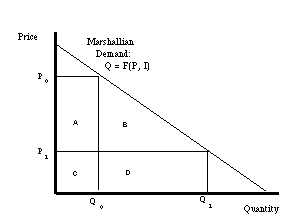
Figure 1: Marshallian Consumer Surplus
Given a specification for the demand curve, one can directly calculate
Marshallian consumer surplus by integrating it between any two
prices. In this paper, we use the log-linear specification given
by equation 5. This is one of the most widely used functional
forms for demand models (Oum, 1989) . Its principal weakness
is that it restricts the elasticities to be invariant for different
quantities.[4]
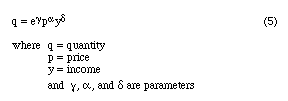
Integrating the demand curve from p0 to
p1
yields:
![]()
Equation (6) can the be used to calculate surplus given prices
and the parameters ![]() ,
, ![]() and
and ![]() .
.
As pointed out by Hicks (1956) , Marshallian consumer surplus
is not an exact welfare measure. This is because a price decline
in a good will increase the effective income available to the
consumer and therefore shift the consumer to a higher utility
curve. The appropriate demand curve to use for exact consumer
surplus is the compensated demand curve, which is the amount that
the consumer would demand if income were adjusted sufficiently
to maintain the same utility level.[5] As shown
in figure 2, a compensated
demand curve will be steeper than the uncompensated demand curve,
but the calculation of surplus is the same conceptually, the sum
of areas A and B, now defined with reference to the compensated
demand curve.
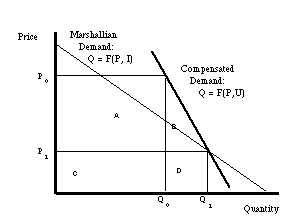
Figure 2: Compensated Consumer Surplus
As with Marshallian consumer surplus, the value of the exact
consumer
surplus can be derived directly from a specified demand curve.
In the log-linear case given by equation (5), the appropriate
formula is given by (7):
![]()
The additional terms, as compared with (6) above compensate for
the implicit change in real income due to the price change by
taking into account the income elasticity of demand. For most
goods, including IT, these terms will be of only second-order
significance, so the Marshallian estimates are usually not a bad
approximation of the exact consumer surplus (Willig, 1976) .
2.5.3 A Non-parametric Derivation Consumer
Surplus
The formulas above for Marshallian and Exact Consumer Surplus
assume that the parameters of a functional form of the demand
curve can be estimated. While this is generally possible, some
error may be introduced in the estimation procedure, especially
if the functional form chosen does not fit the actual demand curve
well. An alternative approach is to explicitly add up each of
the additional increments to consumer surplus from each price
decline. For example, if the price decline from P0
to P1 can be decomposed into a number of
smaller
declines to intermediate prices labeled Pt,
then the sum of price difference times the quantity increase for
each intermediate step will be another measure of consumer surplus.
For instance in figure 3, as in figure 1, area A denotes the
addition to consumer welfare from a decline in price from P0
to P1 on infra-marginal units. Area E
denotes
the increase in welfare from the decline in price on the units
between Q0 to Qt,
labeled
![]() Q.[6]
Q.[6]
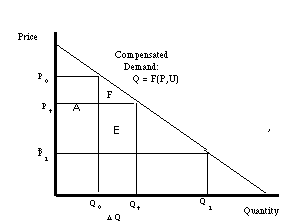
Figure 3: Calculating Consumer Surplus Cumulatively
If the steps ![]() Q are made
sufficiently
small, this approach will be an arbitrarily good approximation
of any monotonically decreasing demand curve, regardless of its
exact shape. In the limit, of course, it is equivalent to integrating
the area between P0 to P1.
While this approach is more tedious than directly integrating
the whole curve, it makes use of data on intermediate points which
may not lie exactly on the equation for the estimated demand curve.
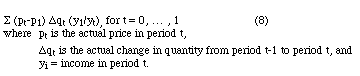
The formula used for this approach is given by equation (8).
Q are made
sufficiently
small, this approach will be an arbitrarily good approximation
of any monotonically decreasing demand curve, regardless of its
exact shape. In the limit, of course, it is equivalent to integrating
the area between P0 to P1.
While this approach is more tedious than directly integrating
the whole curve, it makes use of data on intermediate points which
may not lie exactly on the equation for the estimated demand curve.
The formula used for this approach is given by equation (8).
2.5.4 Applying the theory of index numbers
Consumer welfare is properly a function of the increase in utility
from changes in prices and quantities. One can directly deduce
the increase in welfare from assumptions about the form of the
utility function, without making any direct assumptions about
the form of the demand curve. Following Bresnahan (1986), we
consider a translog utility function, which is one of the least
restrictive available. Applying the theory of index numbers (Caves,
Christensen & Diewert, 1982) we derive the increase in consumer
welfare as given by equation (9).
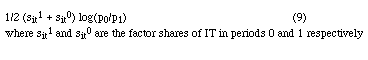
where sit1 and sit0 are
the factor shares of IT in periods 0 and 1 respectively
While each of these methods is slightly different, in principle,
all four methods should yield similar estimates if the assumptions
about the choice of functional form are correct.
We used two primary sources of data for this study: publicly-available
data from the U.S. Bureau of Economic Analysis (BEA) on "office,
computing and accounting machinery" for "OCAM"
and for "OCAM PRICE" and a dataset on computer expenditures
and prices which David Cartwright, a researcher at the BEA, compiled
and provided to us, for "COMPUTERS" and "COMPUTER
PRICE". In addition, we used government data on real gross
domestic product for "GDP" and the GDP deflator for
"INFLATION".
The OCAM data set consists primarily of computers, but also includes
associated peripherals, electronic calculators and many other
office machines. It does not include photocopiers, communications
equipment, software, robots, or scientific instruments. The OCAM
data are based on US National Income and Product Accounts annual
investment expenditures and were allocated across industries using
the BEA's capital flow tables. The data on two digit SIC industries
were grouped into the following eight sectors: agriculture; mining;
durable goods manufacturing; non-durables manufacturing;
transportation
and utilities; trade; finance, insurance and real estate; and
other services. In addition, an aggregate was constructed for
the economy as a whole.
A hedonic price index for OCAM was used to convert the current
dollar flows to constant dollar flows. Thus the total number
of units of OCAM purchased each year were made comparable to what
they would have cost in 1982 based on features such as processor
speed, memory, storage capacity, and display, weighted the relative
proportions of the various types of equipment which comprise OCAM.
The price index for OCAM, divided by the real GDP deflator, was
used for the variable OCAM PRICE.
The separate data series on computers provided by Cartwright did
not include the other types of office equipment that were included
in OCAM. It also had its own hedonic price index which changed
much more rapidly than the one for OCAM. However, these data
were not available by industry, but only for the economy as a
whole.
For gross income, we used GDP. Real GDP, in 1982 dollars, for
each year was also compiled by the BEA for each of the eight sectors
and for the economy as a whole.
The data are subject to a number of limitations. OCAM, COMPUTERS
and GDP, and their associated price indexes, while based on the
most authoritative source available, are each subject to measurement
errors. Also, because the price index used for COMPUTERS was
more recent, and significantly different from, the index used
for OCAM, they are not directly comparable. Finally, all the
data is at a fairly aggregate level, which will tend to obscure
smaller trends in particular companies or of particular types
of computers. However, this data should be useful for addressing
questions like the overall contribution of OCAM and computers
to the economy as a whole and in the eight sectors. Furthermore,
the basic trends which are customarily ascribed to computers --
rapid price declines, significant growth in expenditures, and
explosive growth in overall computer power delivered -- are all
quite evident in this data as well. Intriguingly, when price
and quantity are plotted on the same graph, the curve looks
suspiciously
like a demand curve, even before any estimation, corrections for
income effects, etc. (see figure 4).
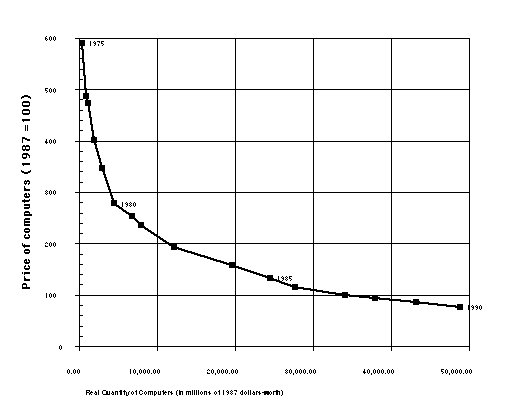
Figure 4: Price and quantity for COMPUTERS
3.2 Methods
3.2.1 Basic Estimating Equation
The key to our approach is getting sensible estimates of the demand
for IT. The value for the price elasticity of demand is particularly
important for the Marshallian and Exact consumer surplus
calculations.
The other two approaches are less demanding of the data. In
fact, the index method requires only that starting and ending
prices and quantities are known.
As described in section 2, for the first two approaches we assume
that the relationship between prices and quantities can be described
by equation (6). In order to estimate this equation, we take
the log of both sides and include an error term, yielding:
A nice feature of this specification is that the coefficients,
![]() , and
, and ![]() ,
can be directly interpreted as the price and income elasticity
of demand, respectively. Depending on the nature of the error
term,
,
can be directly interpreted as the price and income elasticity
of demand, respectively. Depending on the nature of the error
term, ![]() , equation 6 can be
estimated
by Ordinary Least Squares (OLS) regression, which is the technique
we used to estimate the demand function for COMPUTERS.
, equation 6 can be
estimated
by Ordinary Least Squares (OLS) regression, which is the technique
we used to estimate the demand function for COMPUTERS.
In order to take advantage the fact that we had distinct data
for eight sectors on OCAM, OCAM price, and GDP, we estimated these
eight equations simultaneously using the technique of Iterated
Seemingly Unrelated Regressions (ISUR). We also made
cross-equations
coefficient restrictions to increase the efficiency of the estimation.
Because of the potential for serial correlation in time series
regressions, generalized differencing was done for all equations
by including a first-order autoregressive term in each regression.
3.2.2 Simultaneity: A natural experiment and
instrumental variables
estimates
The data we have document the relationship among the three
variables
(p,q,y) for each year and sector. The relationship is governed
by the interplay of both supply and demand, giving rise to a problem
of simultaneity which can make it difficult to identify which
curve is being fitted.
In the case of OCAM and COMPUTERS, this problem is greatly
alleviated
by what amounts to a "natural experiment": due to extraordinary
technological advances, the cost of supplying a unit of computer
power has declined by over 6000-fold in the last 30 years (figure
5).
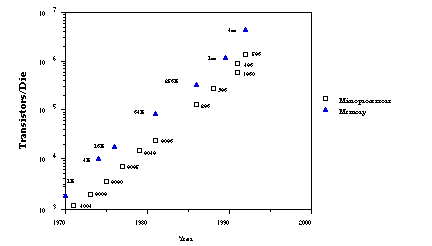
Figure 5: Microchip performance has shown uninterrupted
exponential growth.
This has lead to a significant shift in the supply curve
each year, which effectively "maps out" the underlying
demand curve, since demand has presumably shifted much more
slowly
(see figure 6). For most products, economists can only speculate
as to how much of the good would have been demanded if the price
were 2, 10 or 100 times the current price. In the case of IT,
we have historical evidence of what actually was demanded at such
prices.
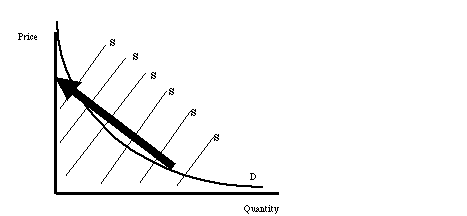
Figure 6. The "natural experiment" of shifting supply
curves. Only the intersections of supply and demand are
observed,
but if the supply curve (denoted "S") shifts, then the
demand curve (D) is revealed.
Presumably demand, too, has shifted over time, but it is likely
that shifts in demand are orders of magnitude smaller than
movements
along the demand curve. For instance, Gurbaxani and Mendelson
(1990) considered the alternative hypotheses that the increase
in computer demand was either due to diffusion or declines in
price. They concluded that since 1970, essentially all of the
increase has been due to price declines. Likewise, Gurbaxani
(1992) estimated a model which included a shift parameter to
account for the diffusion of technology over time, but found that
it added essentially nothing to the regression that included price
and income effects. Accordingly, we follow the tradition pioneered
by Chow (1967) of focusing on price and income effects to explain
computer demand.
We discuss how our results would be affected by unmeasured shifts
in demand in section 4.3. In addition, as a check on the reasonableness
of our estimates using ISUR, we also estimated the equations using
Three Stage Least Squares (3SLS). This technique is designed
to use instrumental variables to filter out endogenous variation
in the independent variables.
Obviously, for the non-parametric method and the index approach,
econometric estimation of the demand curve was not necessary.
4.1 Regression estimates of the demand for
COMPUTERS and OCAM
We estimated the demand for COMPUTERS using equation 6 by the
method of OLS with a correction for serial correlation for 1970
to 1990 (21 observations). Price elasticity was estimated at
-1.33, income elasticity at 3.45 and the constant was -42.08
(see table 1). All estimates were significant at no less than
95%, with the price elasticity significant at over 99%. The R2
was 99%.
| Sector | price elasticity | income elasticity | constant |
| Economy | -1.33 | 3.43 | -42.08 |
Table 1: Elasticity estimates for economy-wide demand for
Computers
The results for the system of equations on OCAM by sector and
for the single equation for the economy as a whole are given in
table 2. In order to correct for potential serial correlation
while still making the problem solvable by our econometric software,
we had to restrict one coefficient to be constant across sectors
in the system of equations, so we restricted income elasticity.[7]
An inspection of the residual for the equation for the economy
as a whole revealed several outliers in the 1974-1976 time period,
possibly due to changes in the calculation of the BEA's price
index for these years. Therefore, we also report results on the
economy as a whole for the period 1977 to 1990.
The estimates for price elasticity varied by sector, ranging from
about -1 in Mining to about -1.7 in Non-Durable Manufacturing.
Services, including Trade, Finance, Insurance and Real Estate,
and Other Services tended to be less price-elastic than manufacturing
and transportation and utilities. The estimates for the economy
as a whole were surprisingly different from the average of the
sectors, probably because fewer data were available for the single
equation estimation of the economy-wide elasticities than for
the system of equations for the sectors. This made the economy-wide
regression particularly susceptible to the outliers in the 1974-1976
period. All of the coefficients were significant at the 95% level
of confidence, with the exception of the constant term in the
two economy-wide regressions. In the system of equations for
the sectors, the price elasticity estimates were all significant
at over the 99% level.
| Sector | price elasticity | income elasticity | constant |
| Agriculture | -1.43 | 1.03 | -8.42 |
| Mining | -0.99 | 1.03 | -6.69 |
| Durable Mfg. | -1.40 | 1.03 | -4.86 |
| Non-Durable Mfg. | -1.71 | 1.03 | -5.30 |
| Transport & Util. | -1.57 | 1.03 | -5.47 |
| Trade | -1.28 | 1.03 | -5.29 |
| Finance, Ins. & RE | -1.15 | 1.03 | -4.16 |
| Other Services | -1.07 | 1.03 | -5.33 |
| Economy | -0.57 | 2.06 | -16.45 |
| Economy, 1977-90. | -0.93 | 1.71 | -14.81 |
Table 2: Elasticity estimates by sector and for the economy
for OCAM
We also ran the system using the 3SLS to correct for potential
simultaneity. Although the demand elasticities were slightly
lower, as expected, the results using this approach were not
significantly
different from the ISUR estimates.
4.2 Consumer Surplus Calculations
As a representative year for our welfare calculations, we chose
1987. GDP (income) by sector and spending on OCAM is given in
table 3.[8]
| Sector | 1987 GDP | 1987 OCAM |
| Agriculture | $ 105,100 | $ 32 |
| Mining | 305,000 | 694 |
| Durable Mfg. | 515,600 | 6,891 |
| Non-Durable Mfg. | 336,600 | 2,349 |
| Transport & Util. | 371,300 | 2,617 |
| Trade | 655,900 | 5,517 |
| Finance, Ins. & RE | 560,600 | 15,485 |
| Services | 592,600 | 7,579 |
| sum of 8 sectors | 3,442,700 | 41,164 |
| Economy | 3,442,700 | 41,164 |
Table 3: GDP and OCAM Spending by sector.
(in millions of 1982 dollars.)
Applying the methods described in section 2.5 and the regression
results of section 3.1, we derived estimates of the surplus for
COMPUTERS and OCAM for 1987.[9] Table 4
gives estimates using
equations
7, 8, 9, and 10 respectively for COMPUTERS. Surplus is estimated
at between $69 billion and $73 billion, which, when compared with
$25 billion in spending, suggests that consumers keep about three
out of every four dollars of gross value created by computers.
(The total gross value generated is equal to consumers' surplus
plus expenditures.)
| Marshallian Surplus | Exact Surplus | Cumulative Method | Index method |
| $70,574 | $73,178 | $69,052 | $70,175 |
Table 4: Consumer Surplus estimates for COMPUTERS. The
figures are the surplus created for consumers by the price decline
in COMPUTERS between 1970 and 1987, in millions of 1982 dollars.
The estimates are all remarkably consistent, despite the different
methods used to derive them. The closeness of the Marshallian
and Exact estimates of consumer surplus are consistent with the
claim of Willig (1976) that for most goods, income effects are
relatively small and can be ignored without much loss of precision.
The fact that the cumulative method is also close to the first
two estimates springs from the good fit of the regression used
to estimate demand, whose parameters were used in equations 7
and 8. The index method is not based on any explicit assumptions
about demand, but does assume a translog utility function, which
can give rise to the log-linear demand function we estimated.
Table 5 gives estimates using equations 7, 8, 9, and 10 respectively
for OCAM, by sector and for the economy as a whole.
| Sector | Marshallian Surplus | Exact Surplus | Cumulative method | Index method |
| Farming | $50 | $50 | $64 | $46 |
| Mining | 790 | 791 | 2,012 | 1,001 |
| Durable Mfg. | 9,061 | 9,143 | 11,129 | 9,942 |
| Non-Durable Mfg. | 4,020 | 4,044 | 3,508 | 3,389 |
| Transport & Util. | 3,612 | 3,630 | 2,905 | 3,776 |
| Trade | 7,343 | 7,386 | 10,997 | 7,960 |
| Finance, Ins. & RE | 19,044 | 19,381 | 16,898 | 22,342 |
| Services | 6,166 | 6,199 | 7,446 | 10,935 |
| sum of 8 sectors | 50,086 | 50,625 | 54,960 | 59,392 |
| Economy,
(using 1970-1990 regression estimates) | 2,757,094 | 16,794,771 | 57,179 | 59,392 |
| Economy,
(using 1977-1990 regression estimates) | 74,732 | 76,141 | 57,179 | 59,392 |
Table 5: Consumer Surplus estimates for OCAM by sector and
for whole U.S. economy. The figures are the surplus created
for consumers by the price decline in OCAM between 1970 and 1987,
in millions of 1982 dollars.
For OCAM, as for COMPUTERS, most of the estimates of consumer
welfare are fairly consistent with one another. The exception
is the estimates of Marshallian and Exact surplus estimates for
the economy as a whole when the years 1970-1976 were included.
This can be directly attributed to the relatively poorly fitting
regressions used to derive the required parameters. The sector
with the largest surplus by all methods was Finance, Insurance
and Real Estate, which ironically is not only a sector with minimal
measured productivity gains according to official statistics,
but also one with among the worst measures of output.
When the surplus from each of the eight sectors is summed, the
total is about $50 billion, not far from the estimates of the
economy as a whole using the cumulative and index methods, but
significantly less than the estimates based on the regressions
for economy-wide OCAM demand (i.e. the Marshallian and Exact
surplus).
When the OCAM and COMPUTERS estimates are compared, it is
surprising
to note that more surplus is generated by COMPUTERS than by their
superset OCAM, which is supposed to include all computers as well
as certain other goods. One might be tempted to conclude that
the additional goods in OCAM, such as hand calculators, actually
subtract from welfare. However, a simpler explanation
exists. As mentioned in section 3, the price index used for COMPUTER
was more recent and showed substantially greater improvements
in price/performance than the one used for computers in OCAM.
According to Allan Young, the director of the BEA, the government
eventually intends to adopt the COMPUTER price index, created
by Cartwright (1986) , for OCAM as well. When this is done, we
would expect the estimates for consumer surplus from OCAM to
increase
commensurably.
The Marshallian and Exact estimates of consumer surplus are
relatively
robust to changes in the estimates for the price elasticity of
demand: 50% changes in price elasticity lead to less than 10%
changes in the surplus estimates. On the other hand, they can
be quite sensitive to the parameters for income elasticity and
the constant term, which shift the entire locus of the demand
curve. This underscores the value of using multiple measures
of consumer surplus to avoid undue influence of any one data point.
A more interesting type of sensitivity analysis is to consider
an outward shift in the entire demand curve. In particular, our
estimates do not include any parameter to account for diffusion
of the technology: we attributed the increase in quantities purchased
over time entirely to lower prices and greater income. While,
as we noted in section 3.2.2, this approach has a long tradition,
it is interesting to consider how much our results would change
if we attribute some of the growth in IT to diffusion. To examine
how this would affect our results, we assumed that COMPUTER and
OCAM would have grown by 2% per year even if the price had been
constant. The net effect of this assumption is to shift the demand
curve outward from what we observed. The top, which is based
on data from 20 years ago, is shifted out far more (i.e. by about
50%) than the bottom, which being based on more recent purchase
decisions presumably already reflects past diffusion. Under this
assumption, the consumer surplus from computers is found to
increase
by about 20%, regardless of the method used.
A third type of sensitivity test is to relax the fundamental assumption
of consumer surplus estimation that the marginal value to the
purchasers of a good is equal to the price the purchasers were
willing to pay for the last unit. If for some reason, (the modeling
of which is beyond the scope of this paper), managers systematically
spend too much on IT, then, by definition, they would not be getting
their money's worth for the last units they buy. However, the
infra marginal units could still be adding to welfare. To be
specific, suppose that OCAM and COMPUTERS only generated 80 cents
of value for each dollar spent on the margin. This is consistent
with an estimate by Morrison and Berndt (1990) regarding the
marginal productivity of "high tech" capital in manufacturing
industries. This would shift the demand curve downward by 20%
and thereby would reduce the gross value (consumer surplus plus
expenditures) created by OCAM and by COMPUTERS to about $80
billion.
Under this scenario, we find that OCAM and COMPUTERS would be
adding $40 billion to $50 billion more to welfare than they cost,
for a net gain.
In fact, if computers and OCAM delivered on average only half
of the benefits that managers expected when they made their
investments,
there would still be a gain from computerization of between $10
billion and $20 billion in 1987. Our consumer surplus estimates
indicate that computers and OCAM would have been a net positive
contribution to the U.S. economy unless managers have been getting
an average of less than 25 cents for each marginal dollar invested
in COMPUTERS and 40 cents for each marginal dollar invested in
OCAM.
Of course, it is also possible that managers have been doing better
than breaking even on their marginal investments in IT. According
to Brynjolfsson and Hitt (1993) , the gross marginal return on
investment (ROI ) for IS capital averaged over 50% in the 1987-1991
time period for their sample of 380 large firms. If one assumes
a five year average service life and a linear decline in ROI over
that time to account for depreciation,[10] firms would be creating
$1.25 of additional net output for each dollar invested on the
margin. This suggests that actual consumer surplus from OCAM
and COMPUTERS could be as high as $80 to $90 billion per year.
Finally, we also examined several base years other than 1987.
In each case, the value of consumer surplus was about 3 times
expenditures for COMPUTERS and about equal to expenditures for
OCAM. This consistency can be attributed to the fact that the
percentage declines in IT prices and increases in quantities purchased
have been remarkably uniform since 1970. Data for each year look
like data for any other year, except for a proportional "rescaling"
of the axes. One implication of this finding is that in the 1960s,
1970s and through the mid-1980s, computer spending and computer
surplus were relatively small as compared to total GDP, and therefore
were not likely to have had measurable effect, one way or the
other, on the "productivity slowdown" at the level of
the whole economy. In the past few years, computer spending has
grown to a magnitude at which one should begin seeing impacts
even in output and productivity statistics for the U.S economy
as a whole. Specifically, our calculations indicate that computerization
added about 0.2% to 0.3% to GDP growth in 1987.
The growth in computer spending and surplus as has been essentially
exponential in the past, and if it continues to be exponential,
this implies a continuing increase in the absolute value of consumer
surplus in the future. For example, if one extrapolates the trends
in computer spending, and assumes GDP growth of 2% per year, one
can estimate that by 1997, total consumer surplus from COMPUTERS
will be nearly $400 billion per year. The comparable figure for
OCAM is a surplus of about $200 billion. The lower number for
OCAM surplus is due to the much slower decline in the OCAM price
index compared to the COMPUTER price index (14% per year vs. 25%).
This paper presents some estimates of the contribution of IT to
consumer surplus. We applied four different methodologies to
data from two different sources and conducted a number of sensitivity
analyses. Our estimates indicate that in 1987, OCAM and Computers
added between $50 billion and $70 billion to consumer welfare,
after expenditures were subtracted, and that the contribution
is growing steadily over time. Our estimates using the different
methods were fairly consistent with one another and reasonably
robust to changes in the underlying assumptions or data.
This approach provides a new perspective on the IT value debate.
It should be emphasized, however, that this methodology does
not directly address the question of whether managers and consumers
are purchasing the right quantity of IT, but rather takes their
preferences as given. For instance, the discrepancy between the
large consumer surplus implied by the methodology used in this
study and the minimal productivity impact found in some other
studies may be due not only to mismeasurement of output, but also
to systematic over-consumption of IT by managers.
The estimates derived should be considered only a first step toward
determining the consumer surplus from IT. There are at least
five extensions that can be pursued in future papers.
First, one could explicitly control for more factors other than
price and income. For instance, including a diffusion or learning
curve parameter, considering computer stocks instead of flows,
and estimating a more general functional form for demand are three
ways to improve the econometrics.
Second, it may be possible to secure data which is disaggregated
further by industry, by type of computer, or for new time periods.
Third, computers are a complementary input for software,
telecommunications,
the information in databases, and even business process redesign.
Since each of these variables has grown rapidly over time, theory
suggests that part of their growth may be fairly attributed to
price declines in computers. In principle, the welfare effects
of this growth, and the share that is related to computer price
declines, can be calculated.
Fourth, surplus from derived demand is a good estimate of final
consumer surplus if markets are competitive and there are no
externalities.
However, the extent of monopoly power and technological spillovers
can be explicitly estimated and used to improve the welfare estimates.
Finally, it would be interesting to compare the contribution from IT implied by the consumer surplus estimates with the contribution implied by other techniques, such as production functions. Any differences found may shed light on the nature of measurement error, or other problems with one or the other method.
Baily, Martin Neil and Robert J. Gordon. (1988). The Productivity
Slowdown, Measurement Issues, and the Explosion of Computer
Power.
In Brookings Papers on Economic Activity, W. C. Brainard,
& G. L. Perry (Ed.), (pp. 347-431). Washington, DC: The Brookings
Institution.
Barua, Anitesh, Charles Kriebel and Tridas Mukhopadhyay. (May,
1991). Information Technology and Business Value: An Analytic
and Empirical Investigation (Working Paper ). University of
Texas at Austin.
Bresnahan, Timothy F. (1986). Measuring the Spillovers from
Technical
Advance: Mainframe Computers in Financial Services. The
American
Economic Review, Vol. 76 (No. 4), pp. 742-755.
Bresnahan, Timothy F. and Manuel Trajtenberg. (July, 1991).
General
Purpose Technologies (Working Paper). National Bureau of
Economic
Research.
Brynjolfsson, Erik. (1993). The Productivity Paradox of Information
Technology: Review and Assessment. Communications of the
ACM,
35 (December).
Brynjolfsson, Erik and Lorin Hitt. (1993). Is Information Systems
Spending Productive? New Evidence and New Results.
International
Conference on Information Systems. Orlando, FL.
Cartwright, David W. (1986). Improved Deflation of Purchases and
Computers. Survey of Current Business, Vol. 66
(March),
7-9.
Caves, Douglas W., Lauritis R. Christensen and W. Edwin Diewert.
(1982). The Economic Theory of Index Numbers and the Measurement
of Input, Output and Productivity. Econometrica, Vol.
50 (No. 6), pp. 1393-14114.
Chow, Gregory C. (1967). Technological Change and the Demand for
Computers. American Economic Review, Vol. 57
(December),
pp. 1117-1130.
Clemons, Eric K. (1991). Evaluation of Strategic Investments in
Information Technology. Communications of the ACM,
Vol.
34 (No. 1), pp. 22-36.
Cron, W.L. and M.G. Sobol. (1983). The Relationship Between
Computerization
and Performance: A Strategy for Maximizing the Economic Benefits
of Computerization. Journal of Information and
Management,
Vol. 6 pp. 171-181.
De Long, J. Bradford and Lawrence H. Summers. (1991). Equipment
Investment and Economic Growth. Quarterly Journal of
Economics,
(May), pp. 445-502.
Dos Santos, Brian L. , Kenneth G. Peffers and David C. Mauer.
(1993). The Impact of Information Technology Investment
Announcements
on the Market Value of the Firm. Information Systems
Research,
4 (No. 1, March), 1-23.
Gurbaxani, Vijay. (1992). The Demand for Information Technology
Capital: An Empirical Analysis. Decision Support Systems,
8 (September), 387-403.
Gurbaxani, Vijay and Haim Mendelson. (1990). An Integrative Model
of Information Systems Spending Growth. Information Systems
Research, Vol. 1 (No.1, March), 23-46.
Harris, Sidney E. and Joesph L. Katz. (1989). Predicting Organizational
Performance Using Information Technology Managerial Control
Ratios.
In Proceedings of the Twenty-Second Hawaii International
Conference
on System Science. Honolulu, HI.
Hicks, J.R. (1956). A Revision of Demand Theory. London.
Loveman, Gary W. (July, 1988). An Assessment of the Productivity
Impact on Information Technologies (Management in the 1990s
Working Paper #88-054). MIT.
Morrison, Catherine J and Ernst R. Berndt. (January, 1990).
Assessing
the Productivity of Information Technology Equipment in the U.S.
Manufacturing Industries (Working Paper #3582). National
Bureau
of Economic Research.
Oum, Tae Hoon. (1989). Alternative Demand Models and Their
Elasticity
Estimates. Journal of Transport Economics and Policy,
(May), 163-187.
Schmalensee, Richard. (1976). Another Look at Social Valuation
of Input Price Changes. American Economic Review,
Vol.
66 (No. 1), pp. 239-243.
Weill, Peter. (1992). The Relationship Between Investment in
Information
Technology and Firm Performance: A Study of the Valve
Manufacturing
Sector. Information Systems Research, 3 (No. 4,
December).
Willig, Robert D. (1976). Consumer's Surplus Without Apology. American Economic Review, Vol. 66 (No. 4), pp. 589-597.
[1] OCAM is defined by the US Bureau of Economic Analysis to include such office machinery as calculators as well as computers
[2] See Brynjolfsson (1993) for a review of this literature.
[3] Recent work by (Bresnahan & Trajtenberg, 1991) and (De Long & Summers, 1991) suggests that there may be positive externalities to investments in machinery, especially high-tech equipment like computers. To the extent this is the case, the consumer surplus approach will underestimate the true contribution of IT, as would production function and business value metric approaches.
[4] Fortunately, visual inspection of the raw data suggested that the demand curve for IT did have a remarkably constant elasticity regardless of scale, and the high R2 obtained is consistent with this observation.
[5] Because, for a given income, the utility level at price P1 is different from the utility level at P0, there are actually two compensated demand curves which correspond to each end of the price change. In principal, exact surplus can be calculated with respect to either one of them, giving rise to a distinction between "equivalent variation" and "compensated variation". In this paper, I will focus on the latter for simplicity, although the former can be calculated analogously, and would little change the results.
[6] Area F will be of second order significance and can be ignored for small [[Delta]]Q
[7] Given the large changes in IT prices and the relatively small changes in income over the sample period, it seemed more sensible to retain as much sensitivity to price movements as possible.
[8] Spending on COMPUTERS in 1987 was approximately $25 billion.
[9] Note that the estimates of consumer surplus derived in this paper are underestimates of the total surplus since they do not consider the portion of the welfare triangle associated with price declines which occured before 1970. Although these declines may be as large as subsequent declines, they apply to a far smaller quantity of computers, and thus the values derived in this paper should not be far from the "true" values.
[10] These are admittedly somewhat arbitrary assumptions, but they are meant only for illustrative purposes.